You want to make smart choices for your future money.
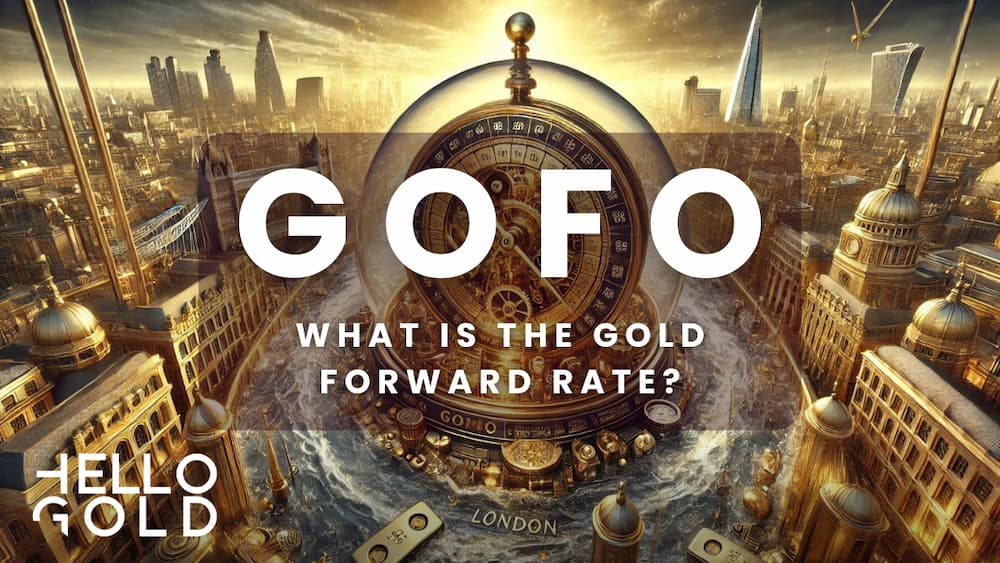
The Gold Forward Rate (GOFO) is a tool that can give you insights into the gold market. Learning about GOFO helps you understand gold trends.
This knowledge lets you expand your portfolio beyond typical investments.
Don’t be scared – this article breaks down GOFO so you can use it to help yourself.
Decoding the Gold Forward Rate (GOFO)
To really understand the ins and outs of the gold market, it’s important to look beyond just price changes. Enter the Gold Forward Offered Rate, or GOFO – a key measure that gives valuable insights into gold market dynamics and potentially signals future trends.
GOFO is an important indicator that shows the complex relationship between gold and U.S. dollar markets.
It’s not just about the cost of gold, but rather about how gold and currency liquidity interact.
Understanding GOFO can give you a big advantage in making smart decisions about gold investments.
What in the World is GOFO?
At its heart, GOFO represents the interest rate for swapping gold for U.S. dollars.
More specifically, it’s the cost of borrowing gold using dollars as collateral.
While this idea might seem complex at first, it’s basically about understanding the relative value and demand for gold versus U.S. dollars in the short term.
The concept of GOFO came about after the gold standard was abandoned in 1971.
As the financial world tried to find new ways to value and trade gold, GOFO became an essential tool for market participants.
The London Bullion Market Association (LBMA) began publishing daily GOFO figures in 1989, providing much-needed openness to the gold market.
What makes GOFO different from other gold-related metrics is its unique perspective on the relationship between the precious metal and American currency dynamics. While other indicators focus on gold prices or supply and demand, GOFO serves as a gauge of gold liquidity, showing whether there’s more immediate appetite for physical gold or for U.S. dollars.
It’s important to note that since January 30th, 2015, GOFO rates are no longer publicly published but are quoted privately by dealers. This change has made the metric somewhat harder to access, but no less important for those involved in gold trading and investment.
The GOFO Recipe: How It’s Cooked Up
To really understand GOFO, it’s crucial to break down its calculation. The formula is straightforward:
GOFO = Gold Lease Rate (GLR) – London Interbank Offered Rate (LIBOR)
Let’s look at these components in detail:
Gold Lease Rate (GLR):
This is the rate at which gold can be borrowed. It represents the cost of “renting” gold for a specified period.
London Interbank Offered Rate (LIBOR):
This is the benchmark rate at which major global banks lend to one another for short-term loans. It’s a key indicator of the overall health of the banking system.
The relationship between these two components determines whether GOFO is positive or negative, which can have big implications for gold market trends.
Several factors influence GOFO rates:
- Supply and demand for physical gold
- Interest rates in the broader economy
- Economic conditions and market sentiment
- Central bank policies, particularly those affecting interest rates
For instance, high demand for physical gold might increase the Gold Lease Rate, potentially pushing GOFO lower or even into negative territory. On the other hand, in times of economic stability with lower gold demand, GOFO tends to be positive.
To illustrate this concept, let’s consider a real-world example:
Suppose the Gold Lease Rate is 1.5% and LIBOR is 2%. In this scenario, GOFO would be -0.5% (1.5% – 2% = -0.5%).
This negative GOFO could indicate a shortage of physical gold in the market, as it suggests it’s more expensive to borrow gold than to borrow dollars.
Understanding GOFO can provide valuable insights into market conditions.
Historically, a negative GOFO has been associated with potential increases in gold prices. However, we must bear in mind that following the implementation of Zero Interest Rate Policies (ZIRP) by many central banks, the reliability of GOFO as a definitive predictor of gold trends has become less clear-cut.
For those interested in gold investments, here are some practical applications of GOFO knowledge:
- While exact GOFO figures may not be publicly available, understanding GOFO trends can provide insights into potential market shifts.
- GOFO should be considered alongside other indicators such as gold prices, economic data, and geopolitical events for a more complete view of the market.
- GOFO fluctuations, particularly when negative, could signal rapid changes in the gold market. This information can be used to adjust investment strategies accordingly.
- While GOFO is a short-term indicator, its trends over time can inform long-term investment decisions in the gold market.
GOFO and Gold Prices: A Love-Hate Relationship
The Gold Forward Offered Rate (GOFO) and gold prices share a complex relationship that offers valuable insights into the gold market’s inner workings. Understanding this relationship is crucial for those seeking to spread out their investment portfolio with gold.
GOFO indicates the differential between gold lending and U.S. dollar borrowing rates. It’s calculated using a simple formula:
The Gold Forward Rate (GOFO) is calculated by subtracting the key interbank lending rate (LIBOR) from the rate for borrowing gold (GLR).
This calculation captures the essence of the gold-dollar dynamic in the market, providing a unique view on the relative value of these two assets.
When GOFO Goes Positive or Negative
GOFO’s value, whether positive or negative, offers valuable clues about the current state and potential future direction of the gold market.
Positive GOFO scenarios typically indicate a state of contango in the gold market, meaning the future price of gold is higher than the current spot price. For investors, a positive GOFO suggests:
- A stable or potentially bearish gold market
- Enough supply of physical gold
- Lower demand for immediate delivery
Historically, positive GOFO has been the norm, reflecting the usual costs associated with storing and insuring gold. In these situations, investors might consider strategies that capitalize on the future price premium, such as gold futures or forward contracts.
Negative GOFO, on the other hand, is a rarer occurrence and often signals significant market stress. It suggests that it’s less expensive to borrow against gold than against U.S. dollars. For investors, negative GOFO can indicate:
- A potential shortage of physical gold
- High demand for immediate delivery
- Possible bullish trends in gold prices
Readers should be aware that while negative GOFO has historically been linked with rising gold prices, it’s not a guaranteed predictor. The relationship can be influenced by various factors, including central bank policies and global economic conditions.
GOFO: The Gold Market’s Mood Ring
GOFO serves as a sentiment indicator for the gold market, reflecting the interplay between gold and currency liquidity. It provides insights into market participants’ preferences for holding the precious metal compared to the greenback.
As a market sentiment indicator, GOFO can be particularly useful when:
- Assessing overall market liquidity
- Gauging demand for physical gold
- Anticipating potential shifts in gold prices
For example, during periods of economic uncertainty, a declining or negative GOFO might signal increasing preference for physical gold over currencies, potentially preceding a rise in gold prices.
However, it’s crucial to note that GOFO’s predictive power has limits.
The adoption of near-zero interest rate strategies by central banks has somewhat lessened GOFO’s reliability as a standalone predictor of gold trends.
In a low interest rate environment, the relationship between GOFO and gold prices becomes less straightforward.
When comparing GOFO to other market sentiment indicators, such as the Gold/Silver ratio or the Gold Volatility Index, GOFO stands out for its focus on the relationship between gold and currency markets. This unique perspective can provide additional insights when used alongside other indicators.
For those considering gold as part of a spread-out investment strategy, understanding GOFO offers a more nuanced view of the gold market. It allows for a deeper analysis beyond simple price movements, potentially uncovering opportunities that might not be apparent from traditional market data alone.
To leverage GOFO insights effectively:
- Monitor GOFO trends alongside gold price movements
- Consider GOFO in conjunction with broader economic indicators
- Use GOFO as part of a comprehensive analysis, not as a sole decision-making tool
Crystal Ball or Magic 8-Ball? Using GOFO to Forecast Gold Trends
This key metric for gold pricing, often referred to by its acronym GOFO, is a crucial tool for analyzing gold market patterns and possibly predicting future trends.
However, how well it can predict has been questioned, especially in recent years.
This section will explore the details of understanding GOFO and how it relates to other market indicators, giving a full framework for using this tool in gold market analysis.
Reading the GOFO Tea Leaves
Understanding GOFO data requires a careful approach, considering various factors that affect its behavior:
Trend Analysis
GOFO charts offer insights into market feelings.
A falling GOFO often shows increased demand for physical gold, possibly signaling a rising market.
Nevertheless, one must examine these trends across multiple time frames to distinguish real shifts from temporary changes.
Contextual Interpretation
The importance of GOFO rates has changed, especially in today’s low-interest-rate environment. While past benchmarks once provided useful reference points, today’s market conditions require a more flexible interpretation of GOFO levels.
Time Horizon Evaluation
Analyzing GOFO across various periods (1-3 months, 3-6 months, 6-12 months) can reveal differences that may indicate coming market shifts. Differences between short-term and long-term GOFO rates often come before significant market movements.
Data Integrity
Since January 30, 2015, the London Bullion Market Association discontinued the public release of GOFO rates. This change highlights the importance of finding reliable data and checking GOFO insights against other indicators to ensure the accuracy of any conclusions drawn from GOFO analysis.
GOFO vs. The World: How It Stacks Up Against Other Indicators
To fully use the predictive potential of the Gold Forward Rate (GOFO), it’s essential to understand its relationship with other key market indicators.
In the past, there has been a notable connection between GOFO rates and spot gold prices. Negative GOFO rates often preceded substantial upswings in gold valuations.
Nevertheless, in recent years, this connection has weakened, showing the need for a more complete analytical approach that considers a wider range of factors.
The relationship between GOFO and the futures markets also offers valuable insights into market expectations.
For example, the spread between GOFO and gold futures prices can be telling.
A narrowing spread may suggest positive market sentiment, indicating increased demand for the immediate delivery of gold.
In addition to futures markets, GOFO’s connection with broader economic indicators plays a crucial role in accurate market analysis. Factors such as inflation rates and interest rates are particularly important.
For instance, the Federal Reserve’s potential interest rate cuts could significantly impact GOFO and, consequently, gold prices. As of the current date, the market is anticipating a potential interest rate cut by the Federal Reserve, which historically supports gold prices by reducing the opportunity cost of holding non-yielding assets like gold.
While GOFO is a valuable indicator, it should be considered alongside technical analysis to paint a fuller picture of market conditions.
Currently, gold is facing critical technical levels, including the 50-day Simple Moving Average (SMA) at $2,360 and the 21-day SMA at $2,387.
By considering these levels along with GOFO trends, investors can gain a more robust picture of potential market movements.
To effectively apply GOFO analysis in real-world investment scenarios, consider the following strategies:
- Include GOFO as one part of a comprehensive analytical framework. While GOFO provides valuable insights, it should not be relied upon as a standalone indicator.
- Closely monitor central bank policies, particularly in the current environment of near-zero interest rates. These policies can significantly influence GOFO’s predictive accuracy and overall market dynamics.
- Factor in geopolitical tensions, which can cause volatility in both GOFO and gold prices. Current geopolitical uncertainties, such as conflicts involving Iran and Ukraine, enhance gold’s safe-haven appeal and may impact GOFO readings.
- Analyze market dynamics, including ETF holdings and consumer demand patterns, to gain a more complete picture of potential gold price movements. Recent data shows strong consumer demand, particularly in jewelry, supported by price rallies, which contributes positively to gold demand.
Investors should keep in mind that while GOFO remains a valuable tool for gold market analysis, its effectiveness is maximized when used together with a diverse array of analytical tools and a thorough understanding of market dynamics.
The gold market’s future remains a subject of speculation among industry experts. For instance, VanEck anticipates gold reaching $2,800 per ounce in the near term, while J.P. Morgan forecasts a price of $2,500 per ounce by the end of 2024.
However, these projections should be viewed as informed estimates rather than guaranteed outcomes.
GOFO in Action: Making It Work for Your Wallet
Understanding the intricacies of gold’s forward pricing mechanism is important, but the real value comes from using this knowledge to improve investment strategies. This section explores how to effectively use GOFO analysis in your investment approach and avoid common mistakes associated with its use.
Incorporating GOFO into Your Investment Strategy
Incorporating the forward rate for gold into your investment strategy requires a careful and well-rounded approach.
Since the leading gold market authority ceased publicly releasing these rates in 2015, obtaining this data now necessitates alternative sources. Trusted financial data providers and brokerage firms often have access to this information, making it important to build relationships with these sources to get accurate and timely data on gold’s forward rates.
When looking at GOFO trends, it’s important to examine rates across different time periods—short-term (1-3 months), medium-term (3-6 months), and long-term (6-12 months). Steady patterns or big shifts, especially changes from positive to negative rates or vice versa, can give more reliable signals than short-term changes alone.
In the past, negative GOFO rates have often preceded upward movements in gold valuations.
Nevertheless, this correlation has become less dependable in recent years due to changing market conditions, particularly in low-interest-rate environments.
So, while this historical connection is important, it’s essential to recognize its limits in today’s financial landscape.
GOFO analysis works best when combined with other analytical tools.
For a complete view, consider using fundamental analysis, which looks at economic indicators such as inflation rates, GDP growth, and world events.
Additionally, technical analysis-using price charts, moving averages, and other technical indicators-can complement GOFO insights, providing a stronger framework for decision-making.
Watching related indicators is also critical. Factors like interest rates, which have changed traditional GOFO interpretations given the current era of cheap money, and gold lease rates, which directly affect GOFO calculations, should be closely monitored.
Additionally, supply and demand dynamics in the physical gold market play a big role in shaping GOFO trends.
Expert predictions can also provide valuable context for GOFO analysis.
While not perfect, forecasts from institutions like J.P. Morgan, which expects gold prices could reach $2,500/oz as we approach 2025 due to factors such as U.S. fiscal deficit concerns and world tensions, can inform your strategy.
Finally, it’s important to remember that the gold market is always changing. Continuously reassessing GOFO-based strategies and being ready to adapt as market conditions evolve is key to staying ahead in this ever-changing landscape.
Potential Pitfalls in GOFO Analysis
While GOFO can be a valuable tool, it’s important to be aware of its limitations and potential misunderstandings:
Misinterpreting Short-Term Fluctuations
Brief GOFO rate changes may not always signal long-term trends. A sudden increase in physical gold demand might temporarily push GOFO negative without indicating a lasting bullish trend. Always consider the bigger picture and look for consistent patterns over time.
Over-reliance on GOFO
Basing investment decisions solely on GOFO can lead to overlooking other crucial factors. GOFO should be one element in a holistic evaluation that includes other market indicators and broader economic data.
Changing Market Conditions
The interplay between GOFO rates and gold market trends can vary in different market environments. The implementation of ultra-low monetary policy by central banks has changed traditional GOFO interpretations. Stay informed about current market conditions and how they might impact GOFO’s predictive power.
External Factors
World events or major economic shifts can override GOFO signals. A sudden global crisis might drive gold prices up regardless of GOFO rates. Always consider the broader economic and world context when interpreting GOFO signals.
Impact of Central Bank Policies
Central bank actions, particularly regarding interest rates and gold reserves, can significantly influence GOFO and gold prices. Keep a close eye on central bank policies and statements, considering how potential policy changes might affect the interplay between gold lease rates and precious metal market trends.
To reduce these risks:
- Employ GOFO as one component of a diverse analytical toolkit, not as a standalone indicator.
- Regularly update your understanding of GOFO’s role in the current market environment.
- Be prepared to adjust your strategy as market conditions change.
- Consider seeking advice from financial professionals who specialize in gold markets and alternative investments.
The GOFO Time Machine: Learning from the Past
This key metric in gold pricing has a rich history that offers valuable insights for those interested in alternative investments, particularly in the gold market. By looking at its growth and performance over time, investors can gain important understanding to guide their strategies in this unique part of the market.
GOFO’s Greatest Hits (and Misses)
GOFO’s record in predicting market movements has been mixed, with both notable successes and failures. Its performance during times of market stress has often been particularly noteworthy.
During times of financial uncertainty, negative GOFO rates have frequently signaled a surge in appetite for tangible gold assets. This pattern has often come before significant upward movements in gold prices.
A notable instance occurred during the 2008 financial crisis, when GOFO turned negative, indicating a strong inclination towards tangible bullion rather than cash. Investors who recognized this signal and acted accordingly saw big returns as gold prices surged in the following months.
However, one must consider that this relationship isn’t perfect.
The effectiveness of GOFO as a predictive indicator has occasionally been questioned, particularly in recent years.
Changes in market dynamics, including central banks’ adoption of rock-bottom interest rates, have sometimes led to GOFO signals that didn’t match up with later gold price movements.
Several factors contribute to GOFO’s varying levels of accuracy:
- Market liquidity: GOFO tends to be more reliable during periods of financial stress when liquidity concerns are most important.
- Interest rate environment: The current low interest rate climate has changed traditional interpretations of GOFO.
- Supply and demand dynamics: Shifts in physical gold availability can significantly impact GOFO rates.
- World events: Sudden global events can override GOFO signals, leading to unexpected market reactions.
Key lessons from GOFO’s historical performance include:
- Use GOFO as one element in a comprehensive market assessment framework, rather than relying on it in isolation.
- Take into account the overall economic landscape when analyzing GOFO data.
- Recognize that past relationships may not hold in changing market conditions.
- Stay alert to factors that might disrupt traditional GOFO interpretations.
GOFO Through the Ages: From Obscurity to Stardom
GOFO’s journey as a market indicator began in the wake of the Nixon Shock in 1971. As financial markets sought fresh approaches to assess and exchange the precious metal, GOFO emerged as a vital resource for industry professionals and traders.
The gold market saw a significant development in 1989 when the premier organization overseeing the London bullion trade initiated the daily publication of GOFO figures, marking a significant milestone in the indicator’s history. This move brought unprecedented transparency to gold trading practices and raised GOFO’s status as a key metric for gold traders and investors.
Over time, technological advancements have dramatically improved GOFO calculations and accessibility:
- Electronic trading platforms have enabled more accurate and timely GOFO readings.
- Real-time data feeds have allowed for quicker market reactions to GOFO changes.
- Advanced analytics have enhanced the interpretation of GOFO data in the context of broader market trends.
However, the landscape changed significantly on January 30, 2015, when the LBMA discontinued openly sharing GOFO rates. This alteration transformed GOFO into a more specialized tool, primarily accessible to industry professionals with access to private market data.
The significance of GOFO within the gold market has evolved considerably over time. Initially, it served primarily as a measure of gold lease rates, offering a basic indicator for the costs associated with borrowing gold.
However, as financial markets matured and grew more complex, GOFO’s importance expanded. It became a critical indicator of gold market liquidity and investor sentiment, providing valuable insights into how easily gold could be traded and how market participants viewed its value.
In more recent times, the interpretation of GOFO has become increasingly nuanced, reflecting the complex interactions between gold markets and the broader financial systems in which they operate. The dynamics that GOFO tracks are no longer just about lease rates but involve a deeper understanding of how global financial conditions, monetary policies, and market sentiments influence the gold market.
Looking ahead, the application of GOFO could see several potential improvements.
One possible development is the creation of alternative data sources to fill the gap left by the discontinuation of official LBMA figures, making GOFO data more accessible.
Additionally, the integration of machine learning algorithms could significantly enhance the predictive capabilities of GOFO, allowing for more accurate forecasting of gold market trends.
Moreover, as the market landscape evolves, particularly with the rise of gold-backed digital assets, GOFO may need to adapt to these new realities to remain a relevant tool for assessing gold market dynamics.
Final Remarks
GOFO helps you understand gold market trends, but it’s not perfect. Today’s low rates have changed how GOFO works.
Use GOFO with other data like rates, world events, and supply-demand info to make smart choices. Don’t depend on just one number when putting your money into something.
Learn about GOFO from trusted sources. Look at how it connects to other market signs. Think about talking to a money expert to use this info in your investment plans.
By using GOFO wisely, you can make better choices about investing in gold.